
Azure Databricks for Customer Analytics in Retail
Azure Databricks is a unified data analytics platform designed for big data and machine learning. It simplifies the process of analyzing large datasets, enabling businesses to uncover actionable insights. This blog explores how Azure Databricks was implemented for a retail client to perform advanced customer analytics, improving sales and customer satisfaction.
Client Overview
Client: Global Retail Chain
The client operates hundreds of retail stores worldwide and offers an online shopping platform. With millions of customers and transactions every day, the client needed to harness their vast data for actionable insights.
Challenges:
- Data Silos: Data from stores, e-commerce, and customer feedback was spread across multiple systems.
- Slow Processing: Traditional data analysis tools couldn’t handle the volume and velocity of data.
- Predictive Insights: The client wanted to implement predictive analytics for customer preferences and inventory management.
- Scalability: Their current infrastructure couldn’t scale to meet growing data demands.
Solution: Customer Analytics Platform with Azure Databricks
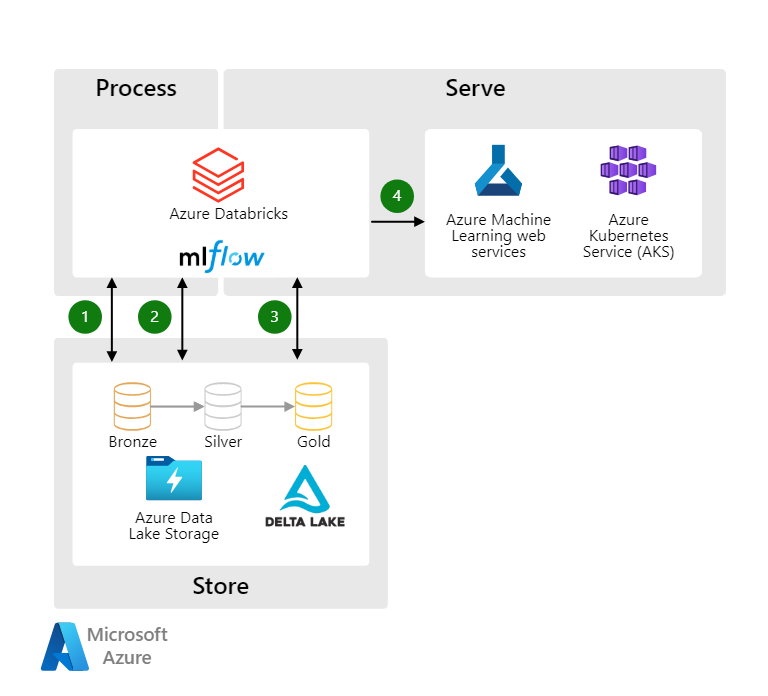
We designed a Customer Analytics Platform using Azure Databricks to unify, process, and analyze customer data at scale. The solution integrated Azure Databricks with Azure Data Lake, Azure Synapse Analytics, and Power BI for end-to-end analytics.
Architecture Overview
- Data Ingestion:
- Data from point-of-sale (POS) systems, e-commerce platforms, and customer feedback were ingested using Azure Data Factory into Azure Data Lake.
- Data Processing:
- Azure Databricks was used to clean, transform, and process large datasets.
- Analytics and Insights:
- Processed data was loaded into Azure Synapse Analytics for advanced querying.
- Insights were visualized in Power BI.
- Machine Learning:
- Azure Databricks’ ML capabilities were leveraged to build models for predicting customer behavior.
Implementation Details
1. Data Ingestion and Storage
- Data was ingested into an Azure Data Lake Gen2 account.
- Ingested datasets included:
- Sales Transactions: Product IDs, timestamps, and revenue.
- Customer Feedback: Reviews and satisfaction ratings.
- E-Commerce Data: Clickstream and purchase history.
2. Data Processing in Azure Databricks
- A Databricks Workspace was created for the client, configured with multiple clusters to process the data.
- ETL Pipelines were built using Databricks notebooks to:
- Remove duplicates and handle missing data.
- Standardize product and customer IDs across datasets.
- Perform aggregations (e.g., total revenue per product, average ratings).
Sample Code: Data Cleaning in PySpark
from pyspark.sql.functions import col, avg
# Load data from Azure Data Lake
sales_data = spark.read.format(“csv”).option(“header”, “true”).load(“path/to/sales_data.csv”)
# Remove duplicates
cleaned_data = sales_data.dropDuplicates()
# Handle missing values
final_data = cleaned_data.na.fill({“revenue”: 0, “product_id”: “unknown”})
# Aggregation example
aggregated_data = final_data.groupBy(“product_id”).agg(avg(“revenue”).alias(“avg_revenue”))
3. Machine Learning for Customer Behavior Prediction
Azure Databricks was used to develop a customer churn prediction model.
- Model Input: Features included purchase frequency, average spend, and customer feedback ratings.
- Model Algorithm: Logistic regression for binary classification (churn or retain).
Sample Code: Churn Prediction
from pyspark.ml.classification import LogisticRegression
from pyspark.ml.feature import VectorAssembler
# Prepare features
assembler = VectorAssembler(inputCols=[“purchase_frequency”, “avg_spend”, “feedback_rating”], outputCol=”features”)
dataset = assembler.transform(final_data)
# Train the model
train, test = dataset.randomSplit([0.8, 0.2])
lr = LogisticRegression(labelCol=”churn_label”, featuresCol=”features”)
model = lr.fit(train)
# Evaluate the model
predictions = model.transform(test)
predictions.select(“churn_label”, “prediction”).show()
4. Insights and Visualization
Processed data and ML results were loaded into Azure Synapse Analytics for efficient querying and reporting. Using Power BI, interactive dashboards were created to:
- Highlight customer churn rates by region.
- Identify top-selling products and underperforming items.
- Analyze customer satisfaction trends.
Use Case in Action
Scenario: Predicting Customer Preferences
- The system identified customers who frequently purchased fitness-related products.
- Using the churn model, it flagged customers likely to stop purchasing in the next 3 months.
- Marketing campaigns targeted these customers with personalized discounts and offers.
- The result was a 25% reduction in churn rate for the fitness category.
Business Benefits
1. Unified Data Platform
Azure Databricks enabled the client to integrate disparate data sources into a single platform, breaking down data silos.
2. Faster Data Processing
- Complex datasets were processed in hours instead of days, allowing near real-time analytics.
3. Predictive Analytics
- The churn prediction model helped retain high-value customers, increasing revenue.
4. Cost Efficiency
- Azure Databricks’ autoscaling reduced costs by adjusting resources based on workload demand.
5. Enhanced Decision-Making
- Power BI dashboards provided actionable insights for marketing, inventory, and customer experience teams.
Leave a Reply
Want to join the discussion?Feel free to contribute!