Power BI Basics: A Beginner’s Guide
What is Power BI?
Imagine a business intelligence suite that seamlessly connects to a plethora of data sources, be it spreadsheets, databases, or cloud applications. Power BI does just that, allowing you to visualize this data in interactive reports and dashboards. These reports and dashboards then translate complex data into easy-to-understand formats, empowering data-driven decision making across your organization.
The Power BI Ecosystem
Power BI offers a versatile suite of tools, each catering to a specific stage of the data analysis process:
● Power BI Desktop: This free desktop application is your playground for building and designing reports. Here, you can import data, transform it, and create compelling visualizations.
● Power BI Service: This cloud-based service acts as the publishing platform. You can upload reports created in Desktop and share them securely with colleagues for collaborative analysis.
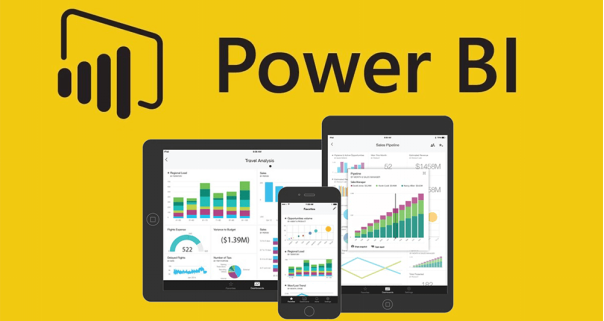
● Power BI Mobile Apps: View and interact with reports and dashboards on the go using the mobile apps available for iOS, Android, and Windows devices.
Building Your First Report
Let’s delve into the process of building a report using Power BI Desktop:
1. Import Data: Power BI connects to a wide range of data sources. For beginners, consider starting with an Excel spreadsheet.
2. Data Modeling: This stage involves shaping the data for analysis. You can create relationships between tables, define hierarchies, and perform calculations using DAX (Data Analysis Expressions).
3. Creating Visualizations: Power BI offers a rich set of charts and graphs, from basic bar charts to intricate maps and funnels. Drag and drop the desired fields onto the report canvas to create visualizations.
Example: Sales Analysis Report
Imagine you have a dataset containing sales figures for different product categories across various regions. You can build a report with:
● A bar chart displaying total sales by product category.
● A pie chart illustrating the regional distribution of sales.
● A line chart tracking sales trends over time.
Sharing Insights
Once your report is finalized, publish it to the Power BI Service. Here, you can share it with colleagues, allowing them to interact with the data, ask questions, and gain valuable insights.
Beyond the Basics
This blog post provides a foundational understanding of Power BI. As you progress, you can explore advanced features like:
● DAX: Unleash the power of custom calculations to create even more insightful metrics.
● Filters and Slicers: Allow users to interactively explore the data from different perspectives.
● Drilldowns: Enable deeper dives into specific data points within the visualizations.
The Power of Data at Your Fingertips
Power BI empowers you to unlock the hidden stories within your data. By following these basic concepts and venturing further into its functionalities, you’ll be well on your way to becoming a data-driven decision-maker.
Ready to Get Started?
Download Power BI Desktop today and embark on your journey to transform data into knowledge!
Additional Resources:
● Microsoft Power BI Learning Resources: https://learn.microsoft.com/en-us/power-bi/


Leave a Reply
Want to join the discussion?Feel free to contribute!