Data Wrangling with Pandas
- Use Cases
- November 05, 2024
-
Data Wrangling with Pandas
Introduction:
Pandas is a free library made for Python. It helps you work with data easily. It gives you tools like Series and DataFrame to manage data, and lots of functions to clean, change, group, and show data. With Pandas, you can do things like clean up messy data, change how it looks, group it together, and make graphs.
Understanding Pandas Data Structures:
Series: Imagine a fancy list with labels. Each item has the same kind of data, like numbers or text.
DataFrame: Think of a spreadsheet. It has rows and columns, where each column holds a different kind of information about your data points (like rows in a list).
Loading Your Data:
Pandas can read data in different ways:
CSV Files: These are files with comma-separated values, like what you get from exporting data from a spreadsheet. Pandas can read these with pd.read_csv().
Excel Files: Got your data in an Excel sheet? Pandas can grab it using pd.read_excel(). Just tell it which sheet you want and how the data is formatted.
Databases: Want to get fancy? Libraries like pandasql let Pandas talk directly to databases, pulling data straight into DataFrames.
Exploring and Cleaning Your Data:
Examining Data Structure: Use df.info() to see what kind of data you have, if there are any missing bits, and how much space it's taking up.
Head & Tail: Peek at the first few (df.head()) and last few (df.tail()) rows to get a glimpse of your data.
Descriptive Statistics: Obtain summary statistics (mean, standard deviation) for numerical columns using df.describe().
Identifying Missing Values: Check for missing values using df.isnull() and df.isna(). Handle them by filling, removing, or interpolating (estimating intermediate values) based on your data.
Using Powerful Techniques:
Picking Data: Choose specific columns (df[['column1', 'column2']]) or rows (df[condition]) based on conditions.
Filtering: Narrow down your data by setting conditions with .query() or logical operators.
Sorting: Put your data in order with .sort_values() by column names.
Grouping & Aggregation: Group your data by a column and do math on it, like adding up or averaging, with .groupby().
Working with Strings in Data:
String Tricks: You can grab parts of words or specific letters using indexing and slicing.
Changing Case: Make everything uppercase or lowercase with .str.upper() or .str.lower().
Regular Expressions: Use special patterns to find and change bits of text with .str methods.
Advanced Tricks:
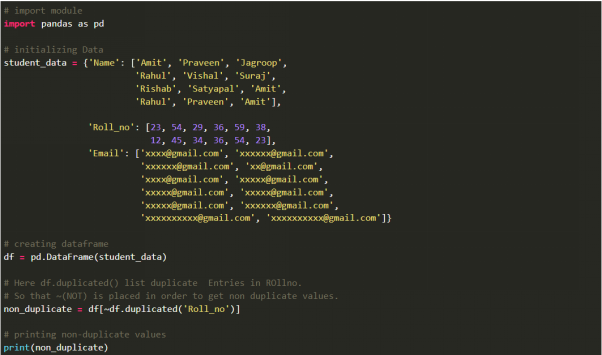
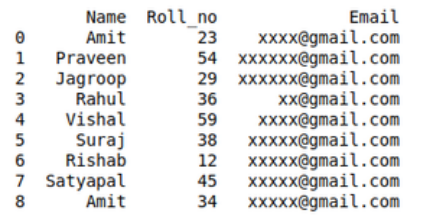
Dealing with Copies: Find and remove or keep rows that are exactly the same with .duplicated(). You can choose which columns to look at.
· Example:
· Output:
Combining DataFrames: Put together data from different tables by matching up columns with .merge(). There are different ways to do this, like only keeping what matches or filling in missing parts.
Changing Data Shape: Make your table wider or narrower with .pivot_table() and .melt().
Start Your Data Journey Today With MSAInfotech
Take the first step towards data-led growth by partnering with MSA Infotech. Whether you seek tailored solutions or expert consultation, we are here to help you harness the power of data for your business. Contact us today and let’s embark on this transformative data adventure together. Get a free consultation today!

We utilize data to transform ourselves, our clients, and the world.

Partnership with leading data platforms and certified talents


