How does Power BI work
- Power Platform
- November 05, 2024
-
How does Power BI work?
Power BI is a powerful business intelligence tool developed by Microsoft, designed to help users transform raw data into meaningful insights. Here's an overview of how Power BI works:
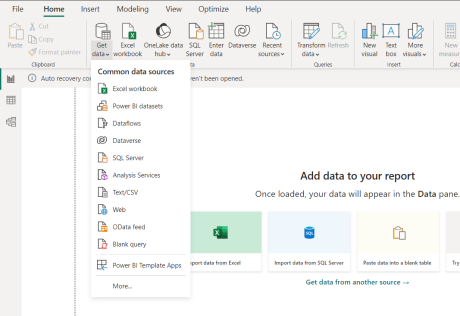
1. Data Connectivity: Power BI can connect to various data sources, including databases, cloud services, Excel files, web sources, and more.
To access these connections, navigate to the "Home" tab, then click "Get data," which will prompt a dropdown menu to appear.
2. Data Transformation: Once the data is connected, Power BI offers tools to clean, transform, and shape the data to suit your analysis needs. Using Power Query Editor, users can perform operations like filtering, merging, splitting, and transforming data columns to make it more usable.
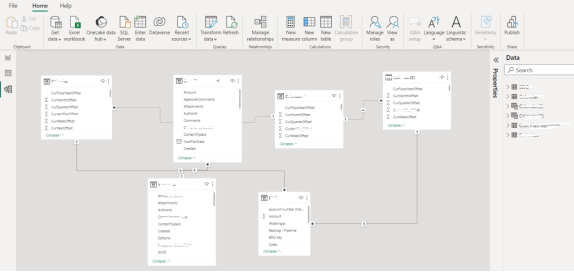
3. Data Modeling: Power BI involves creating data models that organize and relate different data tables. The data modeling section enables users to establish relationships between different tables, define hierarchies, create calculated columns, and measures using DAX (Data Analysis Expressions). Below is an example illustrating the relationship between tables.
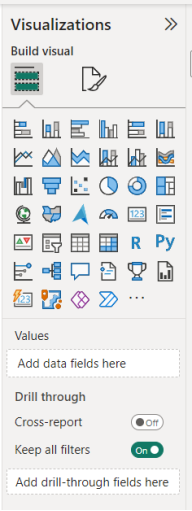
4. Visualization: Power BI provides a variety of visualization options like charts, graphs, maps, tables, and more. Users can create interactive and compelling visualizations by dragging and dropping fields onto the report canvas, customizing visuals, and applying formatting options.
5. Dashboard Creation: Dashboards in Power BI allow users to combine multiple visuals from different reports into a single canvas. Dashboards provide a high-level overview and interactivity, allowing users to drill down into specific details when required.
6. Sharing and Collaboration: Power BI enables users to share their reports and dashboards securely within the organization or externally with stakeholders. It supports sharing through the Power BI service, allowing collaboration, scheduled data refreshes, and access control.
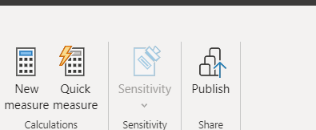
Power BI desktop refresh option:
Navigate to the "Home" tab, then click the refresh icon.

Power BI report publish option:
Navigate to the "Home" tab, then click the publish icon.
Power BI service refresh:
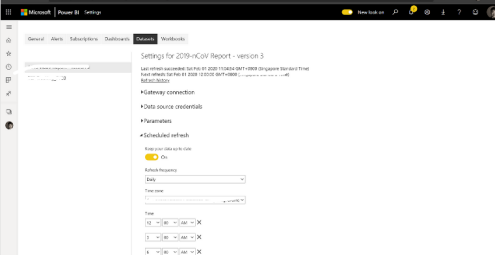
7. Data Analysis Expressions (DAX): DAX is the formula language used in Power BI to create calculated columns, measures, and calculated tables. It's similar to Excel formulas and allows users to perform complex calculations and aggregations on the data model.
8. Integration with Other Tools: Power BI integrates with other Microsoft products like Excel, Azure, and Dynamics 365. It also supports third-party integrations and APIs, extending its capabilities and compatibility with various applications.
Overall, Power BI turns raw data into visual insights. Users can make better decisions. It's an easy tool for data analysis.
ssssssStart Your Data Journey Today With MSAInfotech
Take the first step towards data-led growth by partnering with MSA Infotech. Whether you seek tailored solutions or expert consultation, we are here to help you harness the power of data for your business. Contact us today and let’s embark on this transformative data adventure together. Get a free consultation today!

We utilize data to transform ourselves, our clients, and the world.

Partnership with leading data platforms and certified talents


