Power BI
- Power Platform
- November 04, 2024
-
Power BI
Introduction
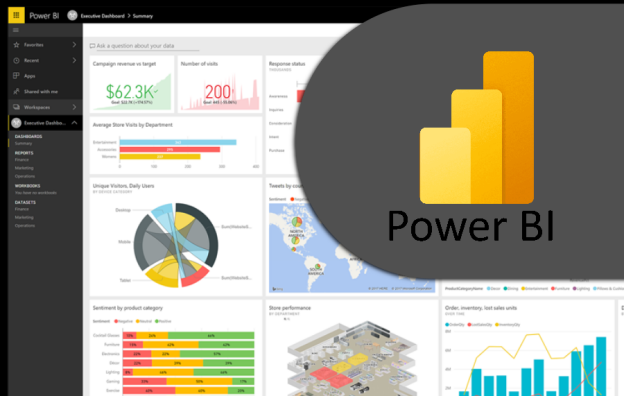
Ø Microsoft Power BI is a data visualization platform used primarily for business intelligence purposes. Designed to be used by business professionals with varying levels of data knowledge, Power BI’s dashboard is capable of reporting and visualizing data in a wide range of different styles, including graphs, maps, charts, scatter plots, and more. Power BI's "AI Insights" functionality, meanwhile, uses artificial Intelligence to find insights within data sets for users.
Ø Power BI itself is composed of several interrelated applications: Power BI Desktop, Pro, Premium, Mobile, Embedded, and Report Server. While some of these applications are free-to-use, paid subscriptions to the pro and premium versions provide greater analytics capabilities.
Ø Power BI is also a part of Microsoft’s Power Platform, which includes Power Apps, Power Pages, Power Automate, and Power Virtual Agents. Created as “low-code tools,” these applications help businesses analyze and visualize data, design business solutions, automate processes, and create no-code chat bots.
What is Power BI used for?
Whether you’re a data pro or are just entering the business world, Power BI is designed to empower you with data-driven insights. Some of the most common uses for the platform include:
Ø Creating reports and dashboards that present data sets in multiple ways using visuals
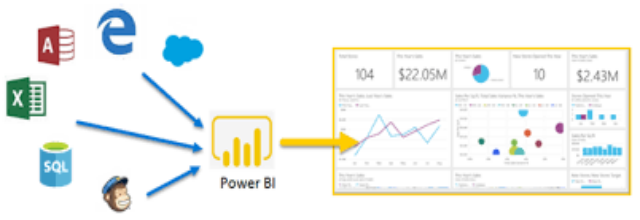
Ø Connecting various data sources, such as Excel sheets, onsite data Warehouse, and cloud-based data storage, and then transforming them into business insights
Ø Turning data into a wide range of different visuals, including pie charts, decomposition trees, gauge charts, KPIs, combo charts, bar and column charts, and ribbon charts – among many other options
Ø Providing company-wide access to data, data visualization tools, and insights in order to create a data-driven work culture
Connecting to data source
Ø Power BI offers a diverse range of connectivity options to cater to various data sources, including spreadsheets, databases, and web services. Whether it's importing data from local files like Excel spreadsheets or connecting to cloud-based databases like Azure SQL, you'll learn how to navigate Power BI's interface to bring your data into the platform.
Transforming and Cleansing Data
Ø Open your dataset in Power BI.
Ø Click on the “Transform data” button to open the Power Query Editor.
Ø Select the columns you want to remove by clicking on their headers.
Ø Right-click on the selected columns and choose “Remove Columns” from the context menu.
Creating Good Visualization
To create good visualization we can:-
Ø Understand the User First.
Ø Choose the Right Chart Type.
Ø Make Proper Use of Color and Text.
Ø Avoid Chart Junk.
Ø Be Clear with Your Data.
Ø Highlight What's Important.
Ø Use Effective Interactions.
Ø Use 3D Wisely.
Adding Interactivity with Filters and Slicers
Ø User can take your visualizations to the next level by adding interactivity Filters and slicers allow them to dynamically explore data and gain deeper insights.

Ultimately, Power BI is able to drive better decision-making in businesses through its ability to provide insights in visually impressive and interactive reports. It established a data-driven culture with BI for everyone. Additionally, it keeps the data secure and includes end to end encryption and sensitivity labeling as well as provides real-time access monitoring
Start Your Data Journey Today With MSAInfotech
Take the first step towards data-led growth by partnering with MSA Infotech. Whether you seek tailored solutions or expert consultation, we are here to help you harness the power of data for your business. Contact us today and let’s embark on this transformative data adventure together. Get a free consultation today!

We utilize data to transform ourselves, our clients, and the world.

Partnership with leading data platforms and certified talents


