Joint Js (Rappid Diagram)
- Data Engineering
- November 04, 2024
-
Joint Js (Rappid Diagram)
The JointJS diagramming library lets you create fully interactive diagramming tools for all modern browsers, relying only on JavaScript and SVG. Its MVC (more MV) architecture separates graph, element and link models from their rendering, which makes it easy to plug JointJS into your backend application. JointJS is not trying to reinvent the wheel for technologies that are commonly used by web developers; things that you learn with JointJS will be useful to you elsewhere.
A diagram in JointJS is represented by a Graph model (joint.dia.Graph) to which you add models of cells - either Elements (subtypes of joint.dia.Element) or Links (subtypes of joint.dia.Link). To present the diagram, attach it to a Paper view (joint.dia.Paper). In JointJS, you manipulate models, not views; the paper generates Element Views and LinkViews for you from the data provided by the graph models. The architecture is illustrated in the following diagram.
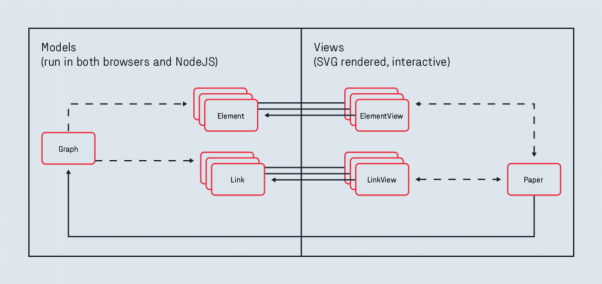
JointJS provides a visual library of common geometric shapes, as well as an extensive collection of ready-to-use components from several well-known diagramming languages (ERD, OrgChart, FSA, UML, PN, DEVS, ...). The JointJS framework has been designed with an eye towards modularity. This makes it easy for advanced users to create their own shapes and to extend built-in functionality with custom plugins. JointJS+, a commercial extension to JointJS, provides a number of pre-made plugins that extend its functionality with widgets, interactive components, and additional shapes (BPMN diagrams).
Rappid in Angular:
Note: Below all the common steps which have been used to create new project and integrate rappid in Angular project:
· Create new angular project for particular graph
· Put Rappid.tgz zip file at project location. And for visio graph project also put rappid-visio.tgz file.
· To integrate rappid in project we require to follow below steps and make changes in different files:
1) Package.Json: - add below line of code:
"dependencies": {
"@clientio/rappid": "file: rappid.tgz",
"@clientio/rappid-visio": "file: rappid-visio.tgz", //Only for Visio graph
"dagre": "latest",
"graphlib": "latest",
"lodash": "4.17.11"
}
"devDependencies": {
"@types/dagre": "latest",
"@types/graphlet": "latest",
"@types/backbone": "latest",
"@types/jquery": "latest"
}
2) Tsconfig.Json: - Add below lines of code:
"compilerOptions": {
"strictPropertyInitialization": false,
"skipLibCheck": true,
},
3) Tsconfig.app.Json: - Add below lines of code:
"files": [
"node_modules/@clientio/rappid/index.ts",
]
· After that run npm-install
· Create new component for graph and add service file to fetch data from that.
· Add canvas container in "component.html". First, add an empty "div" with a class of "canvas", and a template reference equal to "#canvas".
· In " component.ts", import the Rappid dia, ui and shapes namespaces as below:
import { dia, ui, shapes } from '@clientio/rappid';
import { VisioArchive, types, VisioPageContent } from '@clientio/rappid-visio'; //For Visio Graph
· After that, first remember to import ViewChild and ElementRef inside the component class add below lines of code:
@ViewChild('canvas') canvas: ElementRef;
private graph: dia.Graph;
private paper: dia.Paper;
private scroller: ui.PaperScroller;
· Now, let's add an Angular lifecycle method called "ngOnInit" - don't forget to import the "OnInit" interface and implement it in your class
· Inside the "ngOnInit" method add Graph, Paper, and PaperScroller like this:
const graph = this.graph = new dia.Graph({}, { cellNamespace: shapes });
const paper = this.paper = new dia.Paper({
model: graph,
background: {
color: '#F8F9FA',
},
frozen: true,
async: true,
cellViewNamespace: shapes
});
const scroller = this.scroller = new ui.PaperScroller({
paper,
autoResizePaper: true,
cursor: 'grab'
});
· Now, Make changes in Paper based on your requirements.
· Next, we can use another lifecycle method called “ngAfterViewInit” Add it after the “ngOnInit” method
· Inside the "ngAfterViewInit" method, we are able to use our "refs" to work with the DOM elements. Append the created PaperScroller component, center it, and also unfreeze the Paper.
public ngAfterViewInit(): void {
const { scroller, paper, canvas } = this;
canvas.nativeElement.appendChild(this.scroller.el);
scroller.center();
paper.unfreeze();
}
Start Your Data Journey Today With MSAInfotech
Take the first step towards data-led growth by partnering with MSA Infotech. Whether you seek tailored solutions or expert consultation, we are here to help you harness the power of data for your business. Contact us today and let’s embark on this transformative data adventure together. Get a free consultation today!

We utilize data to transform ourselves, our clients, and the world.

Partnership with leading data platforms and certified talents


